Discover the power of data storytelling with MetriVisions’ tools.
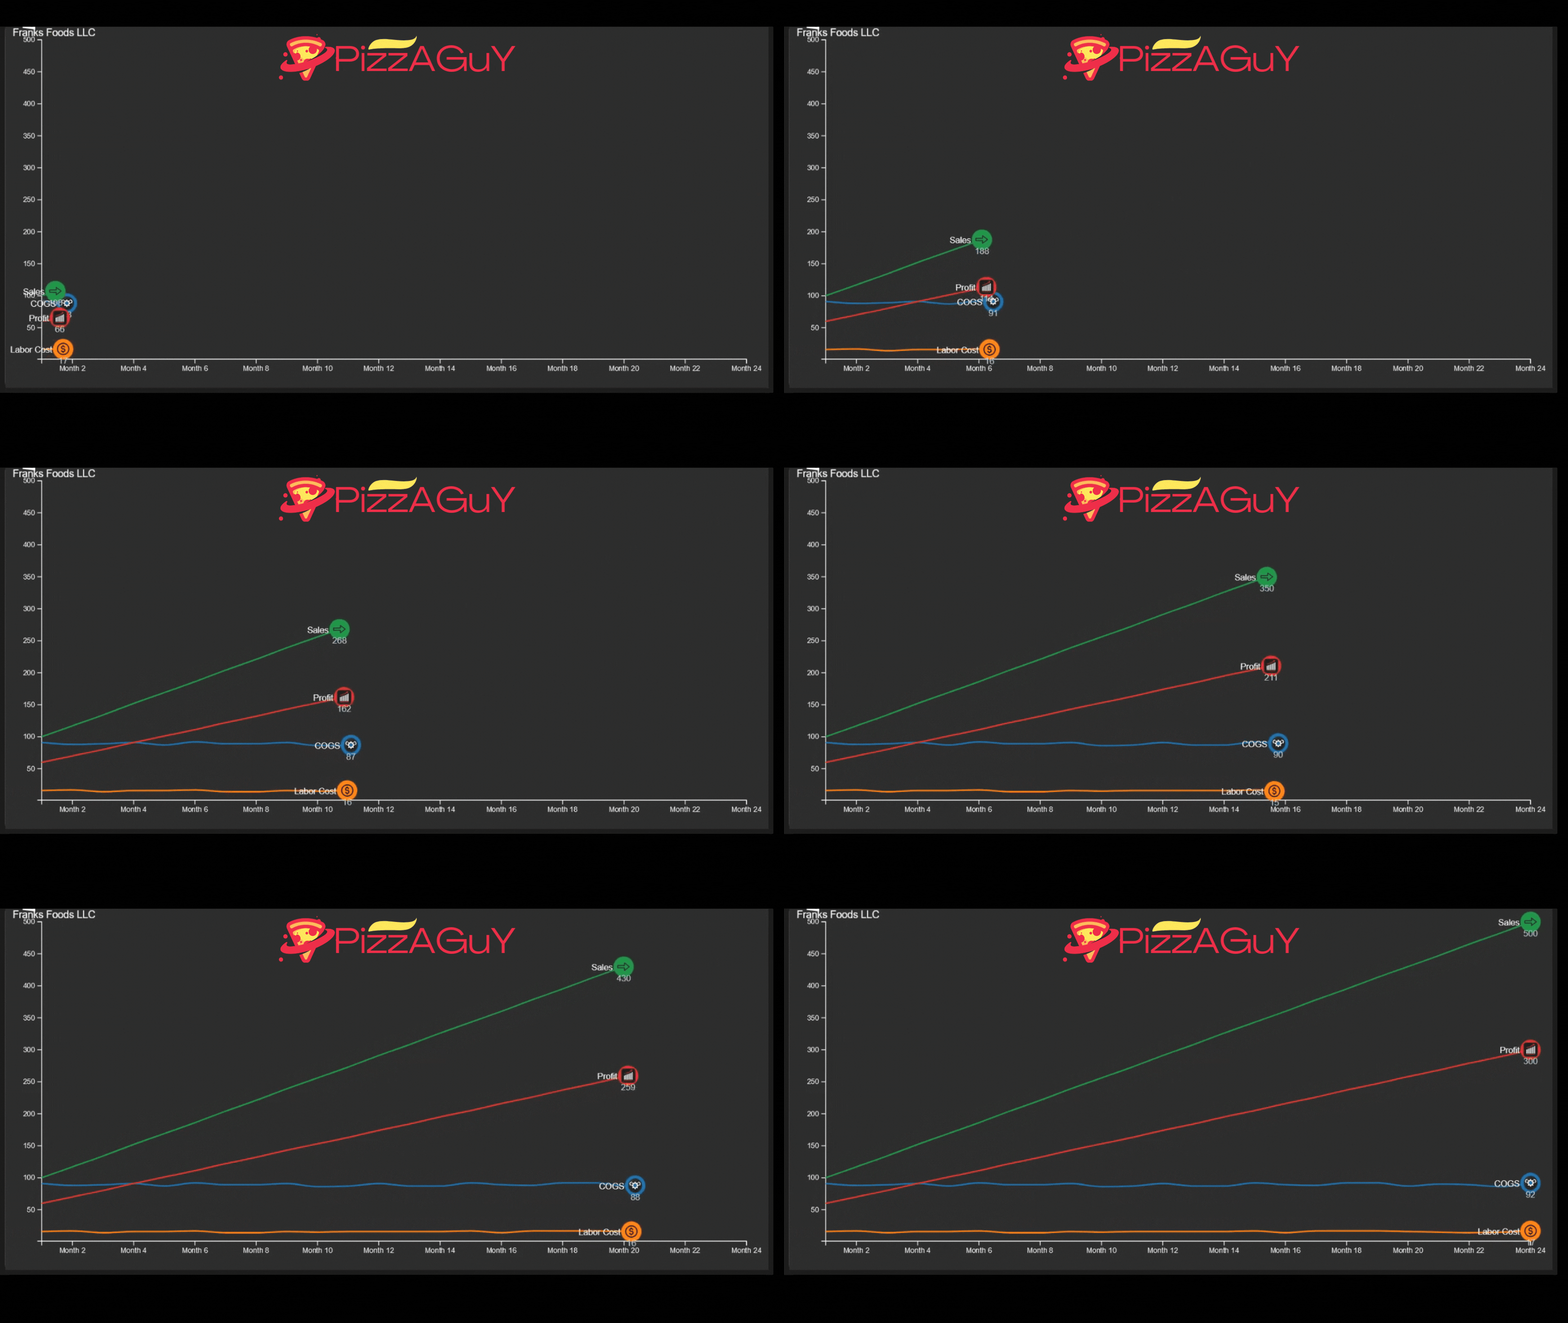
Our most popular tool; The Animated Line Graph—a YouTube sensation featured hundreds of times—delivers dynamic, flowing representations of your data. Perfect for presentations, social media, or interactive dashboards, this tool highlights key moments and shifts in your datasets with smooth, compelling animations.


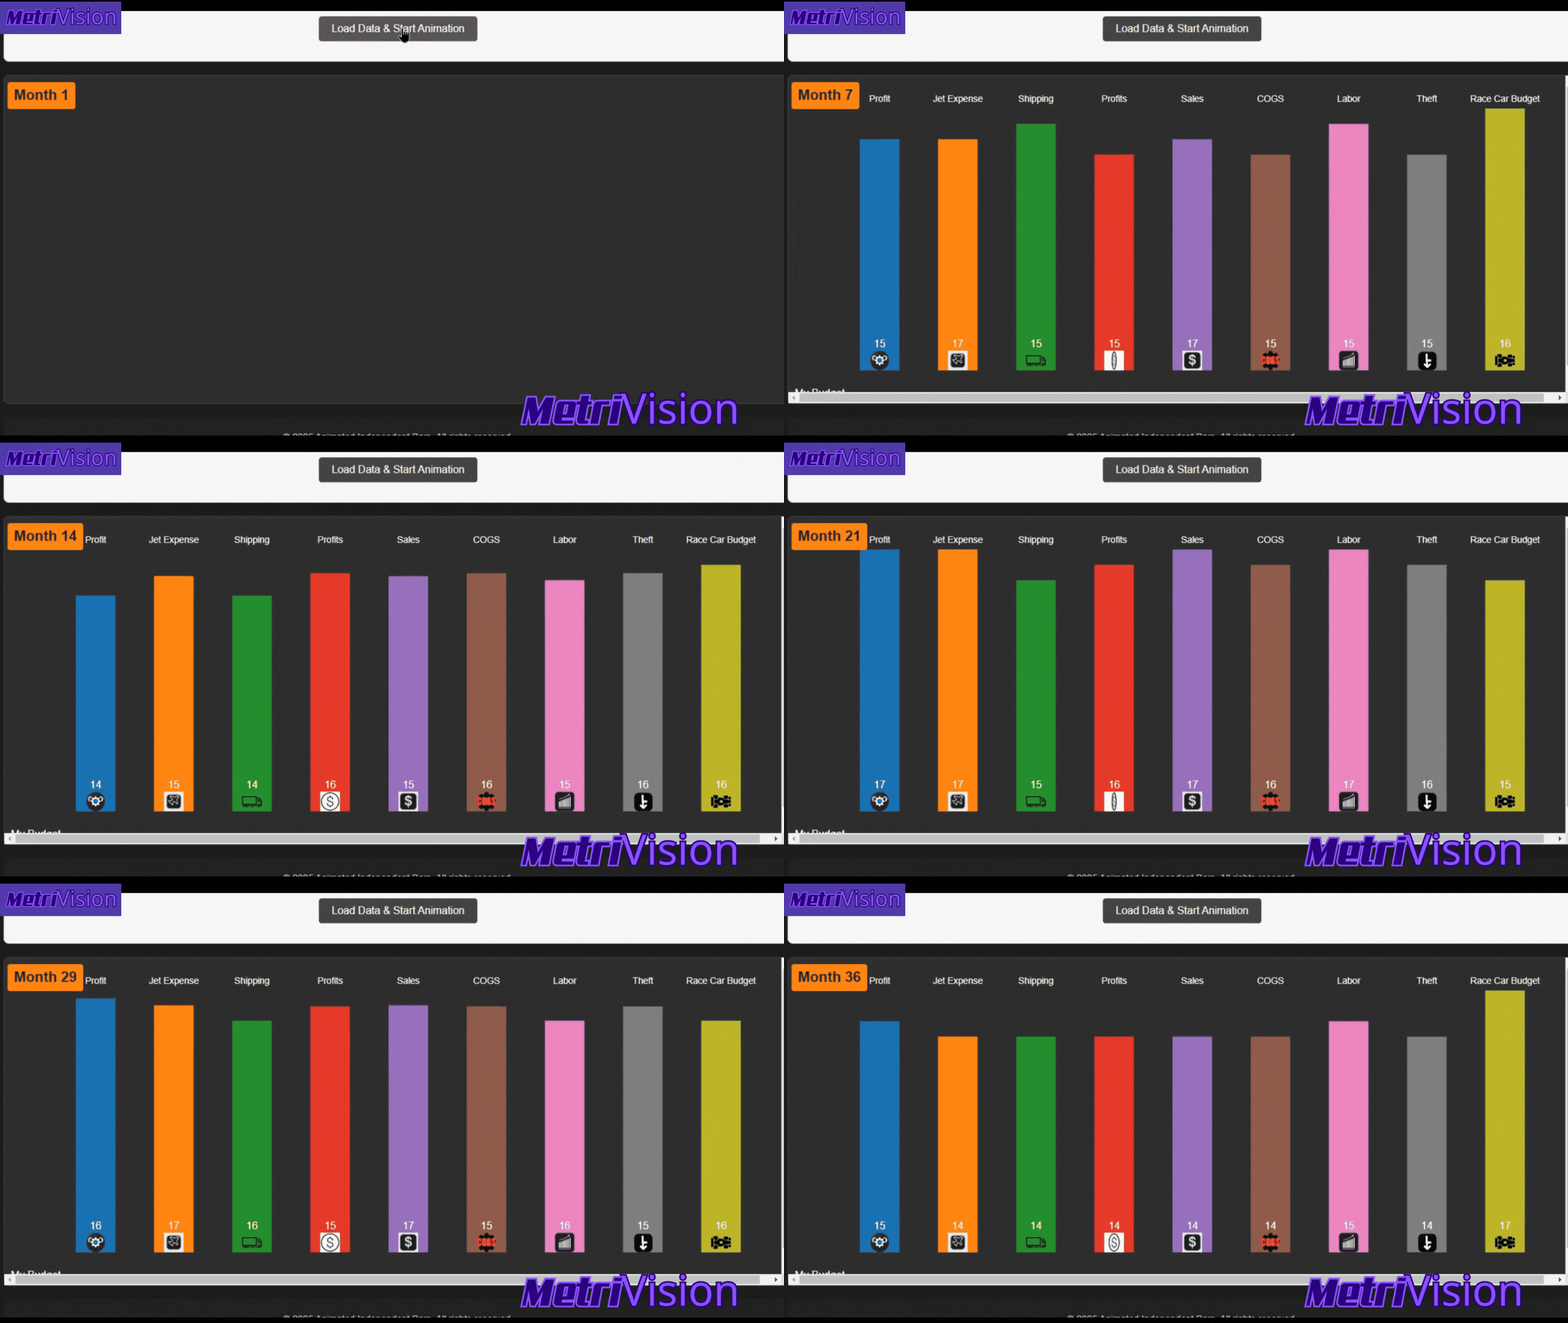
Our Animated Bars tool brings your CSV data to life, animating up to nine distinct data sets—each uniquely identified with its own color, icon, and label. Watch as your numbers transform into vivid, engaging visuals that capture trends and insights at a glance.
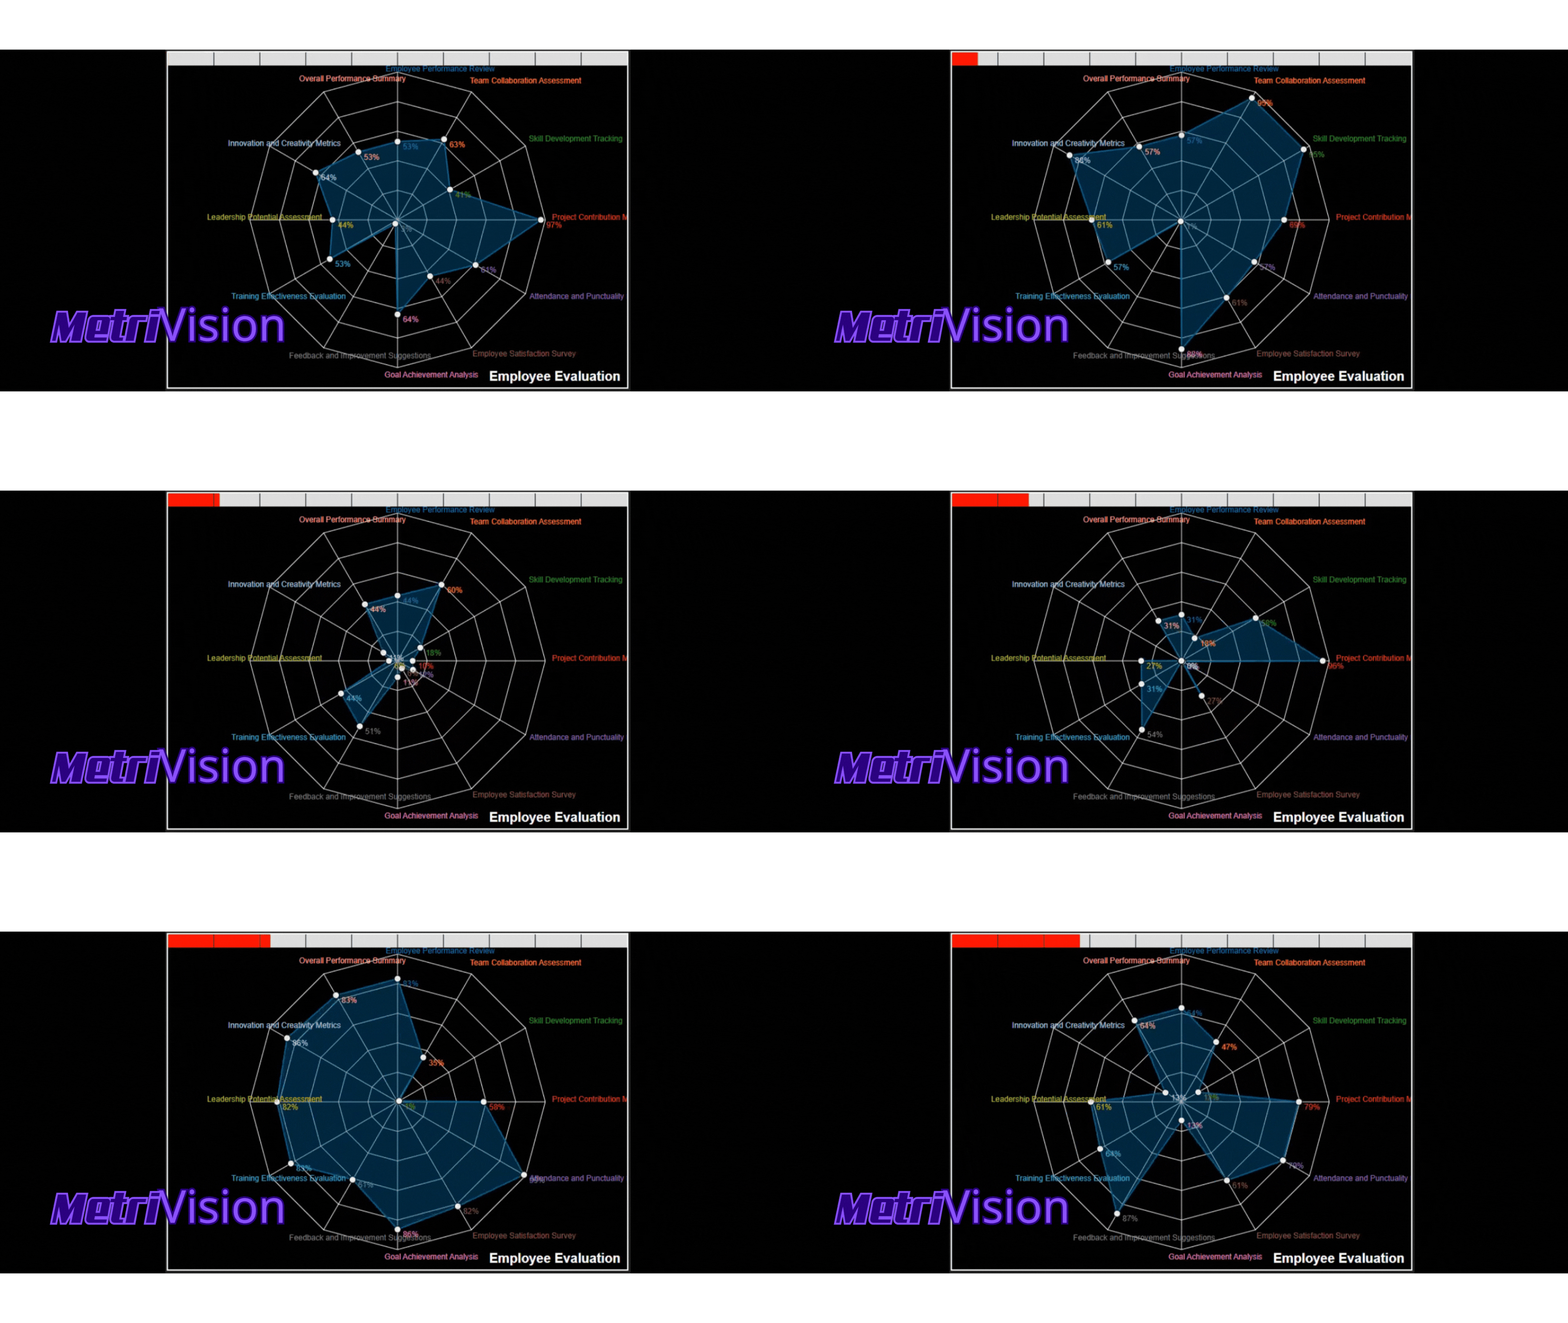
Our Animated Radar Charts.
A dynamic, user-friendly solution for visualizing complex data. Designed for professionals, by using vibrant data points that highlight trends. Perfect for business presentations and strategic analysis, this tool makes your data engaging and insightful.


With an ongoing subscription, you get access to regular updates and improvements, ensuring that our tools evolve alongside your needs.
Unlimited access to all of our data visualization tools.
